The native cryptocurrency of the Avalanche blockchain is currently trading at a critical juncture amid trader indecision, as downward forces threaten to trigger a bearish close to July.
Avalanche (AVAX) is currently trading at a decisive juncture, changing hands at $26.99, down more than 6% over the past 24-hours and over 11% this week.
AVAX has been experiencing significant price volatility over the past four months, with notable trends evident in both the daily and weekly charts. On the daily chart, we can see a pronounced correction from the asset’s peak near $65.39 in March 2024.
This peak was followed by a steep decline, reaching a low of $21.8 in April. Before the collapse to this mark, AVAX bulls mounted robust defense a few days into the end of March. This defense came on the back of increased adoption news for Avalanche after the project announced participation in a partnership between a banking group and Chainlink Labs.
The drop below the $22 mark pushed AVAX below Toncoin (TON) on the list of largest assets and created a critical support level, as the price found some stability and began a mild recovery. Moreover, the Bollinger Bands indicate periods of consolidation, particularly between $29.24 and $41.80, suggesting a range-bound market during this phase.
Notably, the recent movement has shown AVAX hovering around the $27 mark, with a slight rebound noted from the June low. However, the price remains below key Fibonacci retracement levels, particularly the 0.236 level at $32.03.
This resistance level, combined with the proximity to the lower Bollinger Band, suggests cautious trading sentiment. The Klinger Oscillator indicates mixed signals. A stronger positive divergence would be required to confirm a more sustained bullish reversal.
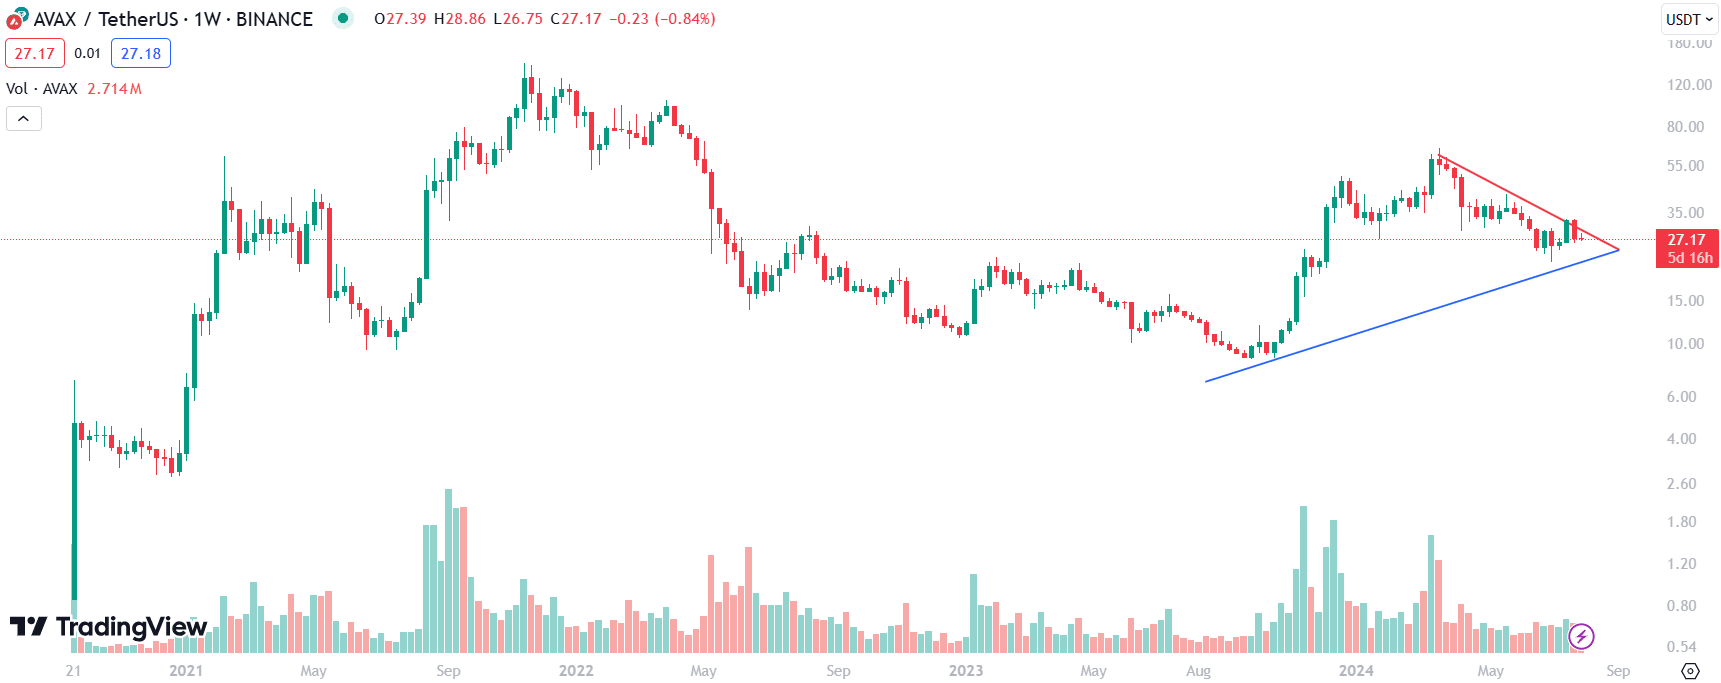
AVAX forms symmetrical triangle on weekly chart
Meanwhile, on the weekly chart, Avalanche has witnessed the formation of a long-term symmetrical triangle. This pattern usually indicates a potential breakout direction. The resistance line, sloping downward from the March high, intersects with a rising support line from the historical lows of around $8.72 in September 2023.

The current price position near the apex of this triangle suggests an imminent breakout, though the direction remains uncertain. AVAX is also witnessing decreasing volume, indicating a period of market indecision. Meanwhile, Avalanche’s native cyptocurrency is on the verge of closing July with a 7% drop.
However, the reduction in volume often precedes a significant price movement as traders await confirmation of the breakout direction. The critical levels to watch would be the local high of $41.8 for a bullish breakout and the support zone near $21.80 for a bearish breakdown.
Data from IntoTheBlock on the volume of large buys and sells confirms the indecision in the market. Notably, bulls have purchased 25.82 million AVAX over the past week, while bears have sold 25.64 million tokens during this period.
A break above the $40 mark could signal a bullish continuation, potentially targeting $55.85, which aligns with the 78.6% Fibonacci level. Conversely, a drop below the $21.80 support could trigger further declines, possibly revisiting previous lows.

